These developer notes assume almost no knowledge. The goal is to learn everything required to write a bare metal operating system for the STM32 by playing and experimentation, diving deeper each iteration and trying to accomplish progressively more difficult tasks.
Essential Software
- Ghidra, for decompiling the system firmware and annotating it.
- OpenOCD, for connecting your laptop debugger to the microcontroller and setting up a gdb instance.
- GDB, for debugging.
- Python for general scripting.
- The rtmidi python package, available on pip.
- The arm-none-eabi-gcc cross-compiler toolchain.
- An ST-Link/V2 debugger for the STM32 architecture.. It costs about $30. Get the real one.
- A screw driver to open the keyboard and seperate the top plate from the bottom.
Operating System Developer Only
If you don’t want to open the device or buy anything beyond a USB cable, you can develop, compile, and burn Open Klave to the MPK2 series using just Ghidra, python, and the arm-none-eabi-gcc tools. However, it’s highly reccommended to get your hands dirty and get all the tools, as there is an essential learning loop between poking the machine in gdb, and learning how to write good routines in c.
Diving in
You can do a lot with just python. You can send sysex commands to the MPK2 device and its factory operating system, for example by using rtmidi to send midi messages from your laptop to the device. Doing this, you can change the colors on the keypads, and even intercept and modify midi messages between the device and your software. You can do just about everything but send messages to the LCD or get extended keypad colors. This is a great resource to play around with that, and this is even better.
The goal of these notes and operating system is to permit keyboard owners to execute arbitrary code with only a USB cable, on top of a lightweight and accommodating operating system. Go get your screw driver and let’s see what we can learn.
Investigating the firmware
Unscrew the screws at the bottom of your keyboard, and investigate the primary printed circuit board.
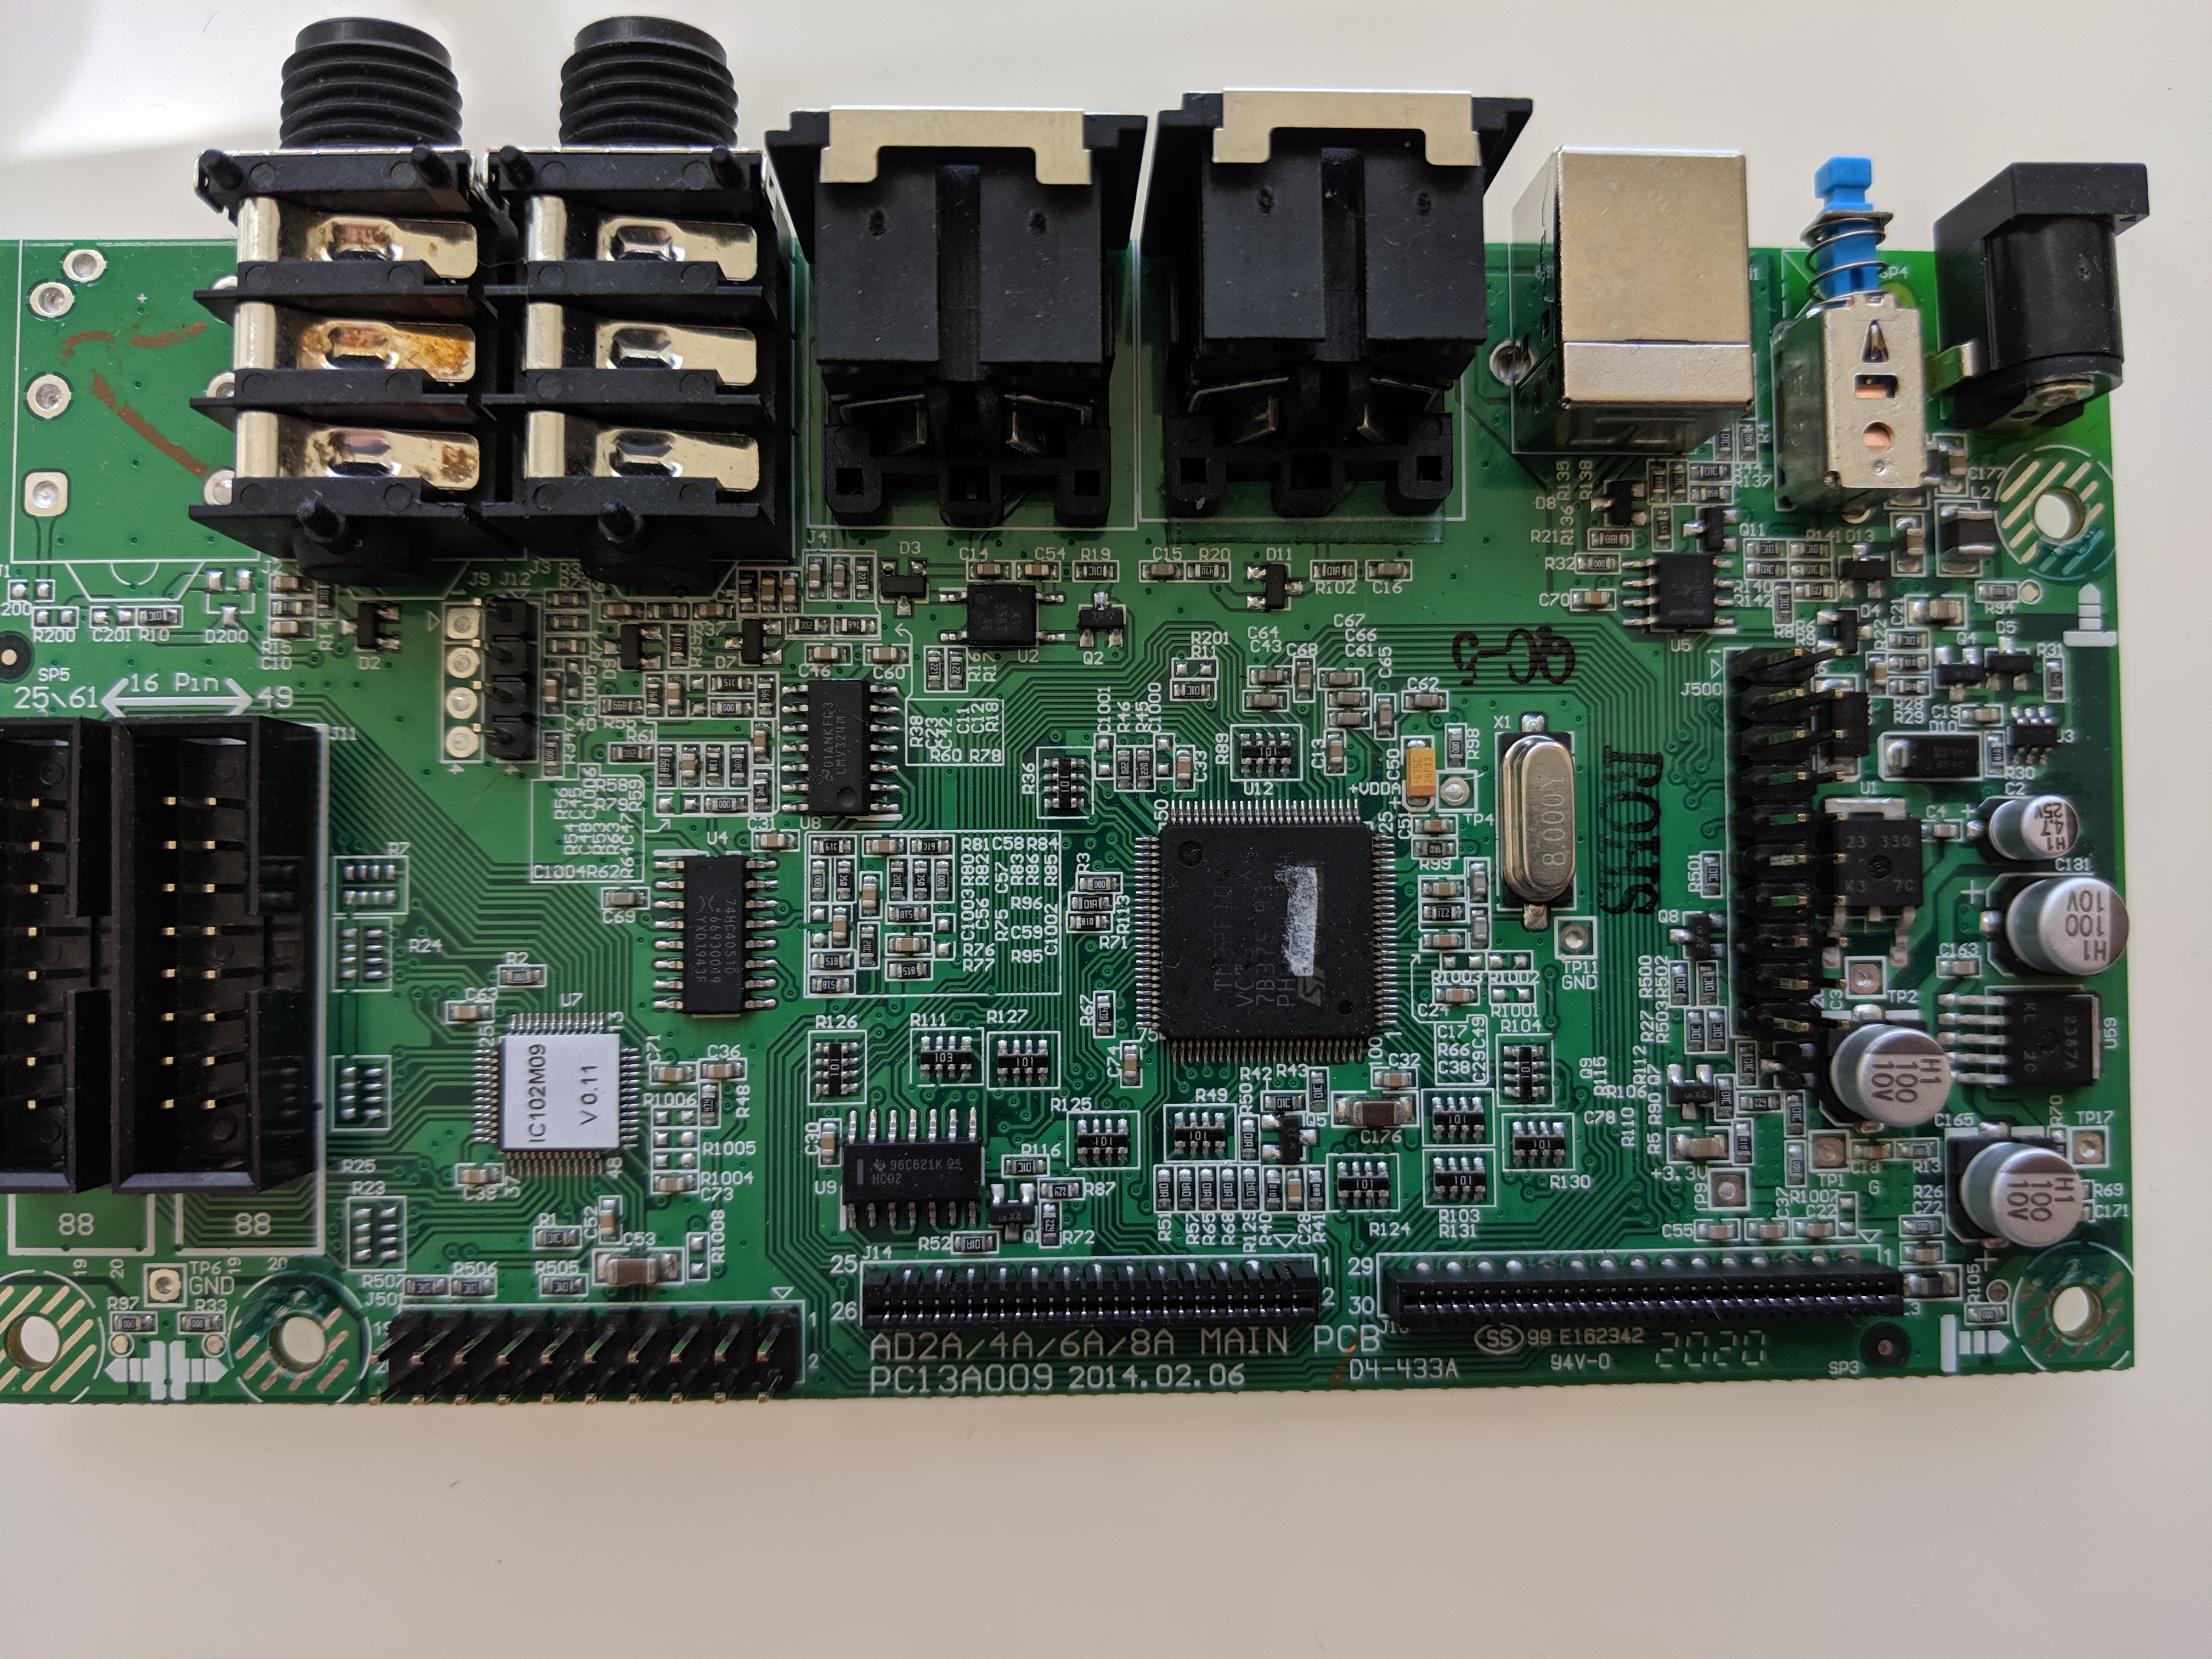
We notice two things. First, its brain is a microcontroller called an STM32F103. Second, it has a 16 pin JTAG connector so you can debug it.
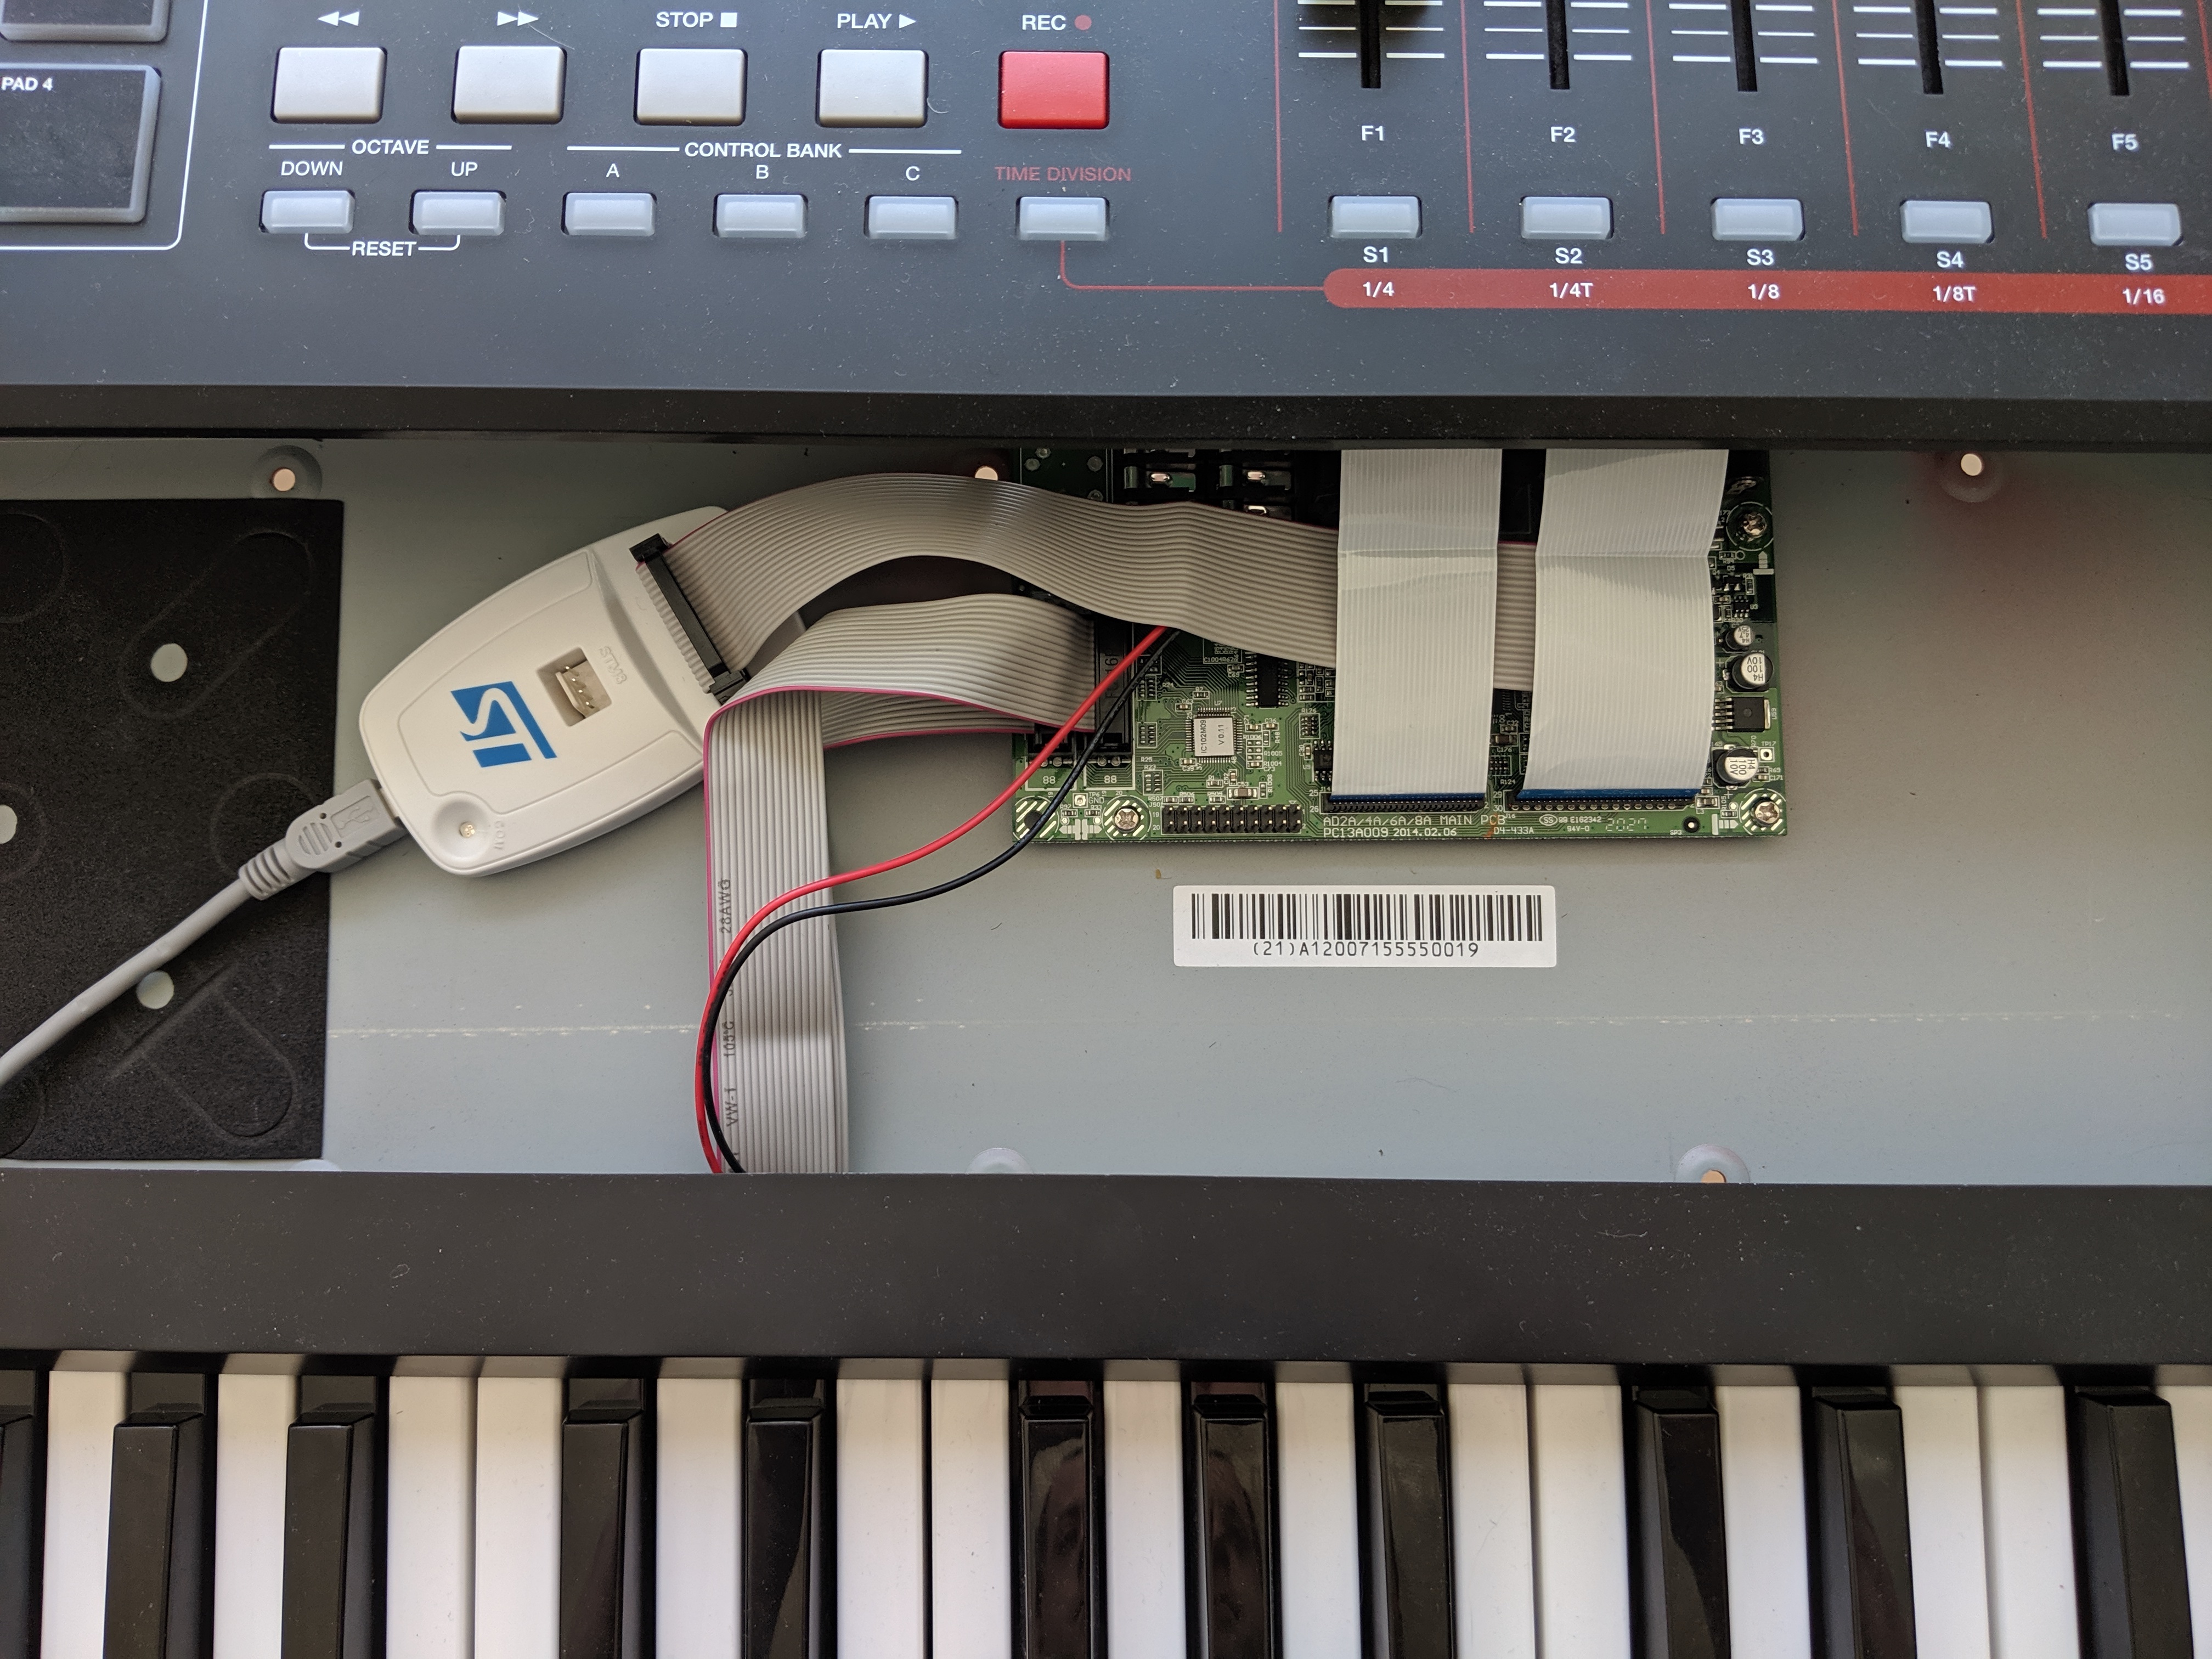
The ST-Link/V2 you bought earlier has a connector which fits snuggly over the JTAG port.
A note on the STM32F103
The STM32F103 runs an instruction set called ARM Cortex M3. The chip is 32-bit and little-endian, which will be important for setting up Ghidra and sending values to it later.
Exercise: Establish a connection to the device and GDB in
Let’s end the tutorial by making sure your tools work. Have you installed python and rtmidi? What happens when you type at the command prompt
python
import rtmidi
quit()
If there are error messages, try again. Please also verify you have installed openocd by typing ‘openocd –version’.
Get connected, for free
Here’s what it should look like once you have the ST-Link/V2 plugged in to the MPK2 JTAG. Note that this method requires 2 active USB connections to work. So you’ll have the ST-LINK/v2 connected to the JTAG port and plugged into your computer’s USB, and you’ll have a second USB connection to the back of the keyboard, to power and send midi back and forth, like you would usually if you were just trying to plug it into a DAW.
Launching the GDB server
Let’s verify all the wires are properly connected. Open up two terminal windows. In one, you will run OpenOCD to launch a GDB server.
openocd -f interface/stlink.cfg -f target/stm32f1x.cfg
If everything is working properly you should see something like
...
Info : STLINK V2J29S7 (API v2) VID:PID 0483:3748
Info : Target voltage: 3.217323
Info : stm32f1x.cpu: hardware has 6 breakpoints, 4 watchpoints
Info : starting gdb server for stm32f1x.cpu on 3333
Info : Listening on port 3333 for gdb connections
...
Now, in a second terminal, start gdb and connect to this local server.
gdb

(in gdb)
target remote localhost:3333
which should display
Remote debugging using localhost:3333
If you did everything right and sucessfully connected gdb to the MPK2, the unit will display cool debug stripes in the light pads indicating the keyboard is in debug mode. Notice how the MPK249 debug mode alters the pad colors between columns of blue and green.
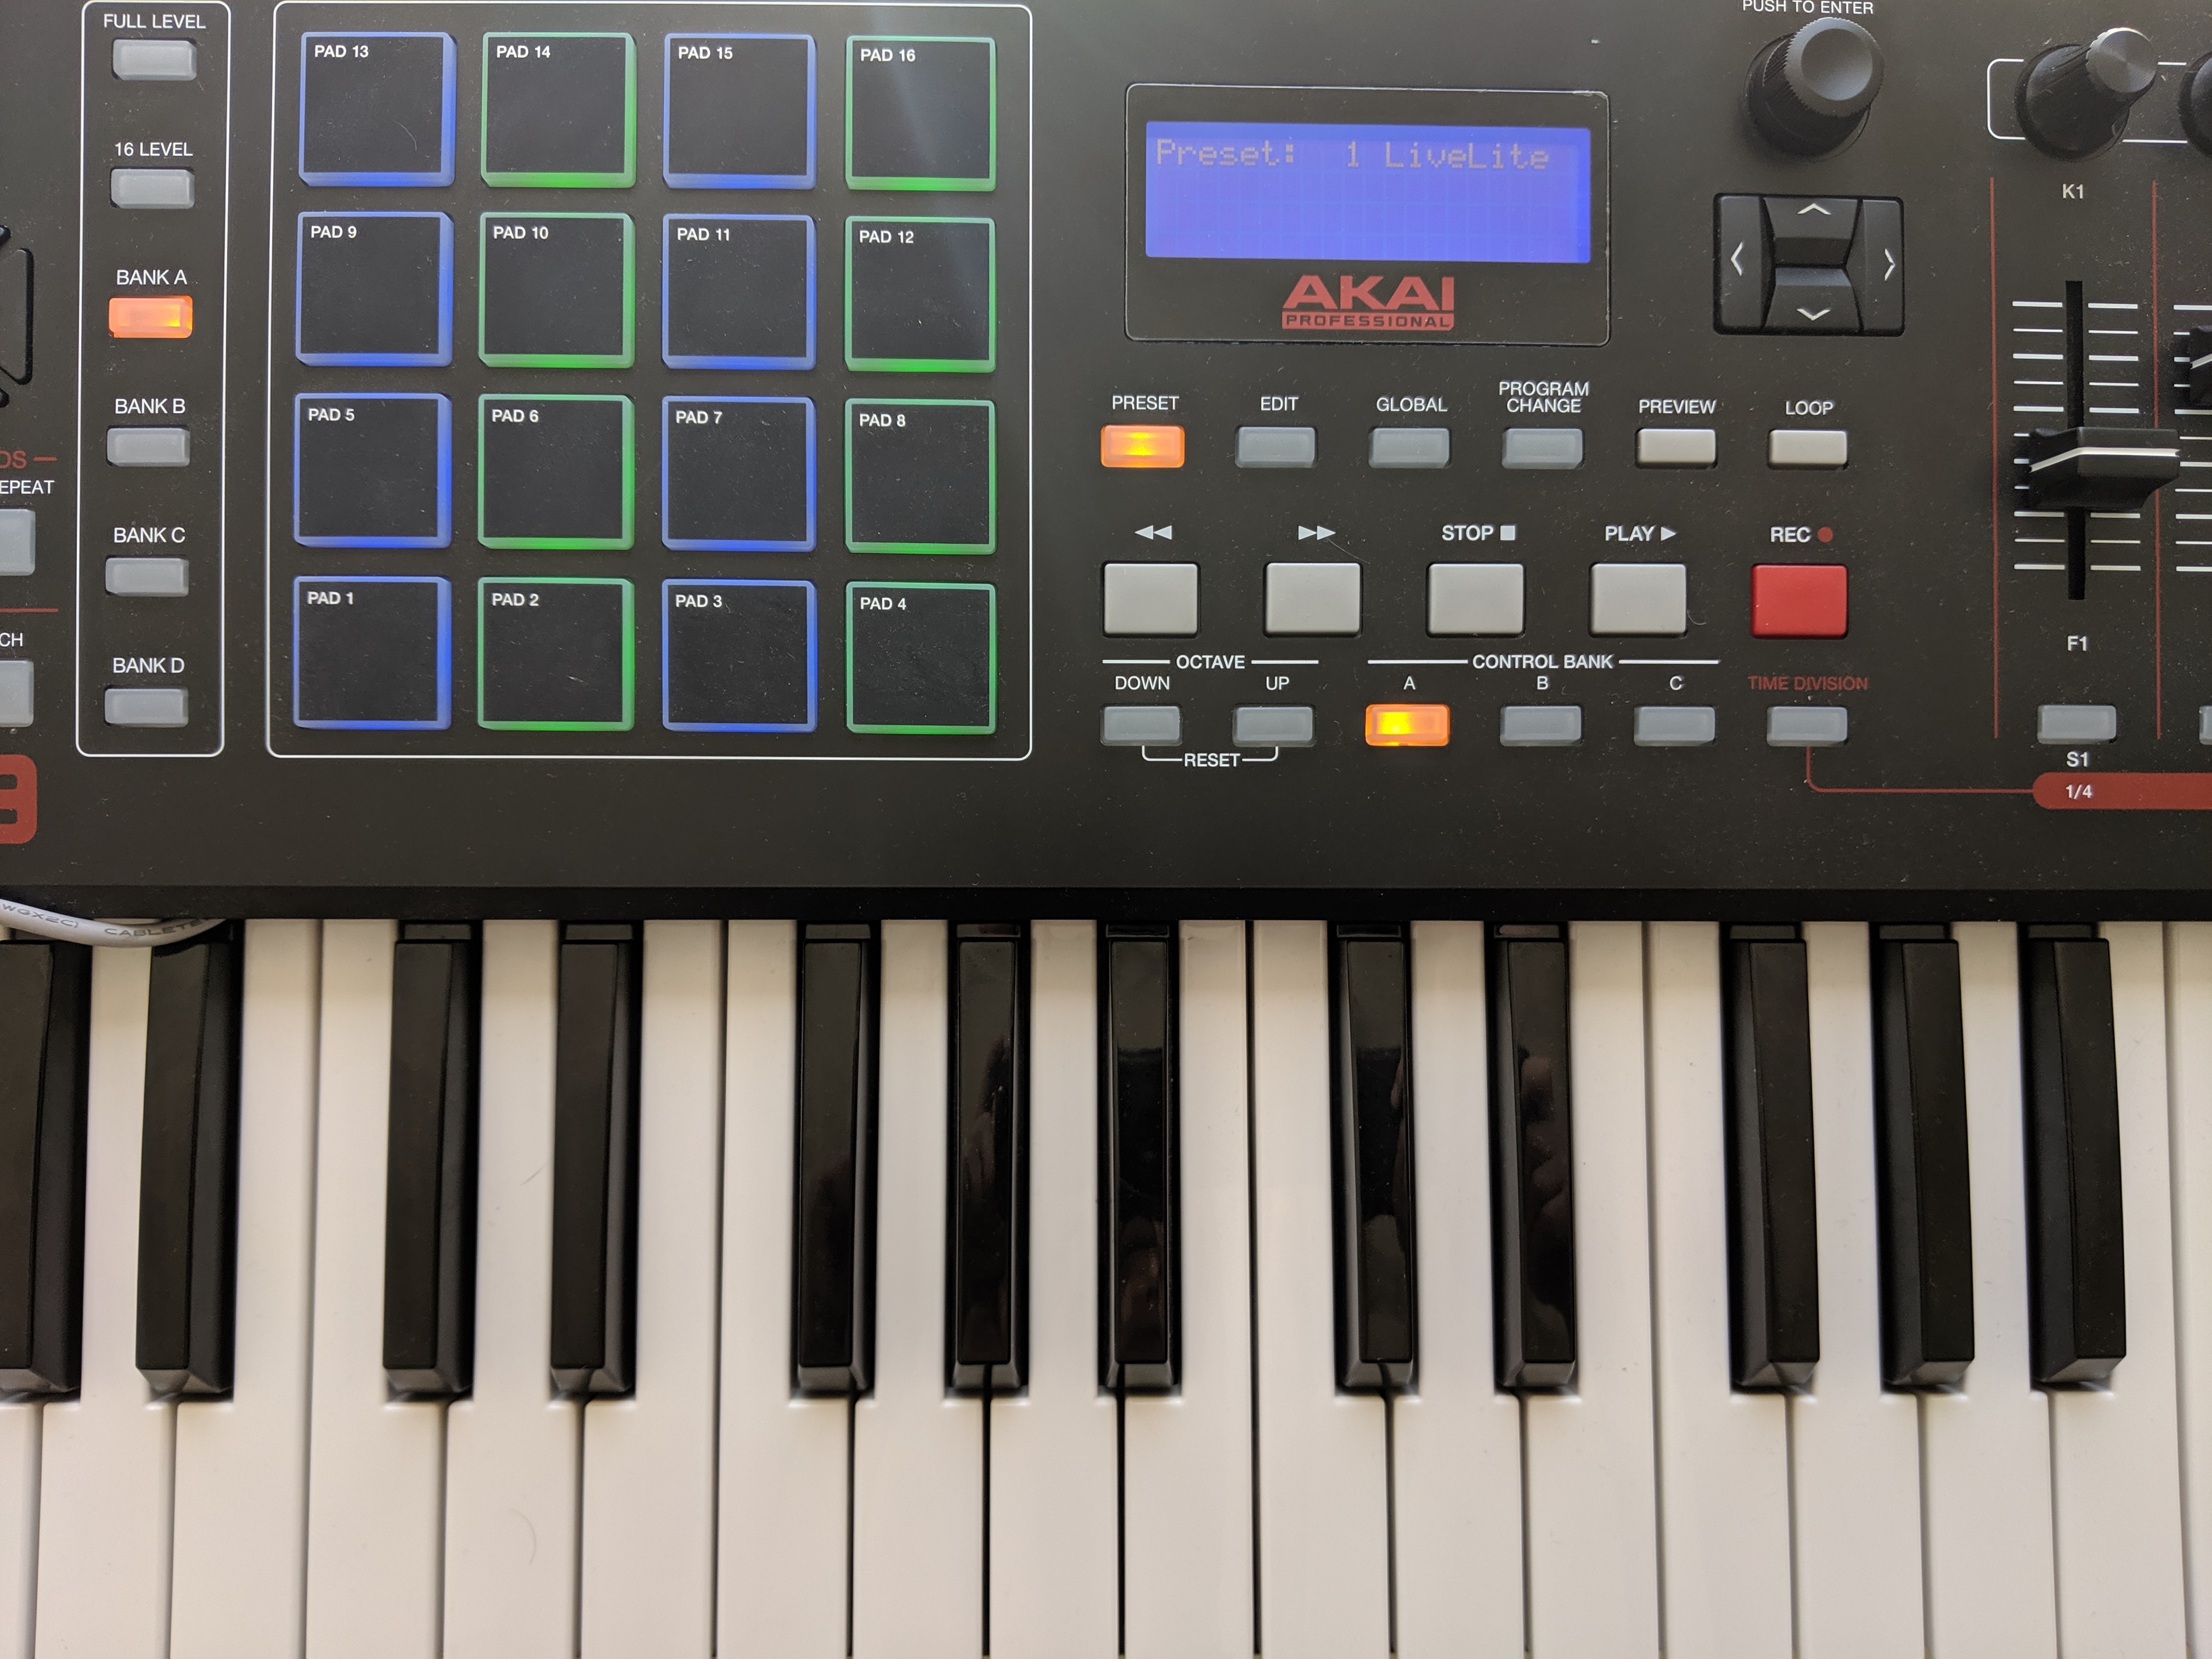
The reason for this is because each pad only has a single red, green, and blue LED. All other colors are simulated by rapidly turning these on and off. In default debug mode, the animation routine is silenced.
When tinkering with the keyboard, it is more comfortable to adjust the plastic hood mostly back over the keys, so you can play notes and test things out as you debug.
- Press CTRL-C to stop the keyboard executing its current program, and enter debug mode.
- Enter ‘c’ to continue execution. PC means ‘program counter’. It is the current instruction that is executing.
- Enter ‘stepi’ to step forward one instruction on the keyboard.
- Reset the keyboard by entering ‘monitor reset halt’. You will need to enter c to start it running like normal.
Whew! Good work!